Initial Results of Modeling
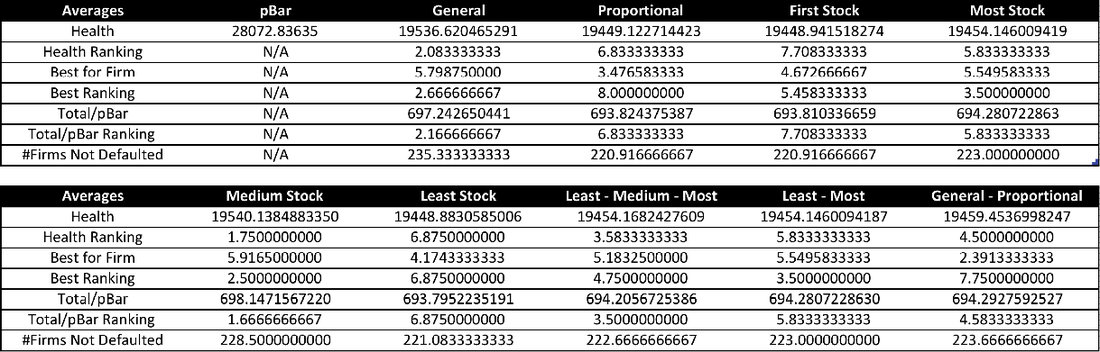
After my first round of testing, I averaged the results of the different financial systems and created the table below. I used nine different strategies for selling off stocks, as shown in the column headers ("General", "Proportional", etc.). I also included a column for what can be considered the potential health for each firm ("pBar"). For each strategy, I ran the code to find the clearing payment vector through MATLAB 100 times for a specific type of financial system, varying the initial liabilities matrix slightly. I did this for 12 different financial systems, changing parts of the financial system each time. For each financial system, I calculated the health of the system ("Health"), the number of times that strategy was best for a specific firm ("Best for Firm"), the sum of the health of each firm divided by the potential health of each firm ("Total/pBar"), and the number of firms that were able to not default in the given strategy ("#Firms Not Defaulted"). For most of these measures, I also included the average ranking to see which strategies did best most often.